 KR Webzine Vol.122
- Dec. 2021
- Nov. 2021
- Oct. 2021
- Sep. 2021
- Aug. 2021
- Jul. 2021
- Jun. 2021
- May. 2021
- Apr. 2021
- Mar. 2021
- Feb. 2021
- Jan. 2021
- Dec. 2020
- Nov. 2020
- Oct. 2020
- Sep. 2020
- Aug. 2020
- Jul. 2020
- Jun. 2020
- May. 2020
- Apr. 2020
- Mar. 2020
- Feb. 2020
- Jan. 2020
- Dec. 2019
- Nov. 2019
- Oct. 2019
- Sep. 2019
- Aug. 2019
- Jul. 2019
- Jun. 2019
- May. 2019
- Apr. 2019
- Mar. 2019
- Feb. 2019
- Jan. 2019
- Dec. 2018
- Nov. 2018
- Oct. 2018
- Sep. 2018
- Aug. 2018
- Jul. 2018
- Jun. 2018
- May. 2018
- Apr. 2018
- Mar. 2018
- Feb. 2018
- Jan. 2018
- Dec. 2017
- Nov. 2017
- Oct. 2017
- Sep. 2017
- Aug. 2017
- Jul. 2017
- Jun. 2017
- May. 2017
- Apr. 2017
- Mar. 2017
- Feb. 2017
- Jan. 2017
- Dec. 2016
- Nov. 2016
- Oct. 2016
- Sep. 2016
- Aug. 2016
- Jul. 2016
- Jun. 2016
- May. 2016
- Apr. 2016
- Mar. 2016
- Feb. 2016
- Jan. 2016
- Dec. 2015
- Nov. 2015
- Oct. 2015
- Sep. 2015
- Aug. 2015
- Jul. 2015
- Jun. 2015
- May. 2015
- Apr. 2015
- Mar. 2015
- Feb. 2015
- Jan. 2015
- Dec. 2014
- Nov. 2014
- Oct. 2014
- Sep. 2014
- Aug. 2014
- Jul. 2014
- Jun. 2014
- May. 2014
- Apr. 2014
- Mar. 2014
- Feb. 2014
- Jan. 2014
- Dec. 2013
- Nov. 2013
- Oct. 2013
- Sep. 2013
- Aug. 2013
- Jul. 2013
- Jun. 2013
- May. 2013
- Apr. 2013
- Mar. 2013
- Jan. 2013
- Dec. 2012
- Nov. 2012
- Oct. 2012
- Sep. 2012
- Aug. 2012
- Jul. 2012
- Jun. 2012
- May. 2012
- Apr. 2012
- Mar. 2012
- Feb. 2012
- Jan. 2012
- Dec. 2011
- Nov. 2011
- Oct. 2011
- Sep. 2011
- Aug. 2011
- Jul. 2011
- Jun. 2011
- May. 2011
- Apr. 2011
- Mar. 2011
- Feb. 2011
- Jan. 2011
- Dec. 2010
- Nov. 2010
- Oct. 2010
- Sep. 2010
- Aug. 2010
- Jul. 2010
- Jun. 2010
- May. 2010
- Apr. 2010
- Mar. 2010
- Feb. 2010
- Jan. 2010
- Dec. 2009
- Nov. 2009
- Oct. 2009
- Sep. 2009
- Aug. 2009
- Jul. 2009
- Jun. 2009
- May. 2009
- Apr. 2009
- Mar. 2009
- Feb. 2009
- Jan. 2009
- Dec. 2008
- Nov. 2008
- Oct. 2008
- Sep. 2008
- Aug. 2008
- Jul. 2008
- Jun. 2008
- May. 2008
- Apr. 2008
- Mar. 2008
- Feb. 2008
04
April 2018
1. Introduction
It is essential that an understanding of the various meteorological and marine environment conditions are incorporated into the design and production of offshore plant substructures or upper platforms in the Arctic environment. Particularly important are the major environmental load factors that can directly affect the installation and operation of plant structures, and the reanalysis of data from meteorological and marine numerical modeling based on observation data, which provides useful information for realistic design and operation conditions.
- Temperature (air/ocean), wind speed
- Wave height, wave period, wave length / current (speed)
- Sea ice thickness, sea ice concentration
While this information can not completely prevent unexpected damage caused by the environmental load factors, it is possible to optimize the design for offshore plant in the Arctic, if sufficient review of the environmental load factor in the region has been conducted.
2. Background of Dataset Selection
To accurately estimate the environmental load factor conditions in the Arctic, it is necessary to use continuous observation data for the targeted area. However, it is not possible to obtain long-term observation data because of the limitations of the distinct characteristics in arctic and marine region.
The numerical forecast model is a kind of program which calculates the numerically physical process and dynamic phenomenon by parameterization using a super computer. The European model, which is currently the operational weather forecast model in KMA and known to have the highest level of accuracy, shares over 90% similarity.
Furthermore, the reanalysis data is simulated from past weather conditions with increased accuracy through the assimilation of observation data (radar, sounding, ship/buoy/aircraft report, radiosonde, pilot balloon, dropsonde, satellite) which is based on the latest numerical forecast model. The reanalysis data is used in the field of weather forecasting and relative research to improve the performance of climate analysis and numerical prediction.

[Flowchart for Operation of Numerical Forecast Model (2010, KMA)]
3. Scope and Region for Study
KR targeted the Kara Sea as a region for study and identified and collected long-term continuous data over more than 10 years from NCAR (National Center for Atmosphere Research) / UCAR (University Corporation for Atmospheric Research) and RDA (Research Data Archive). The reanalysis data for environmental load factors was analyzed through the algorithm developed by KR.
|
ECMWF Reanalysis Data(European Centre for Medium Range Weather Forecasts) |
The comprehensive reanalysis of climate data using observation data from numerical predictions of global atmosphere/ocean/land coupled model. It is used as initial condition for weather forecasting in various global forecast systems and research institutes. |
|
CMEMS Reanalysis Data Environment Monitoring Services) |
The Arctic/ocean physics reanalysis data from the TOPAZ4 system running at MET Norway, with improved accuracy through the use of HYCOMS coupled to a sea ice model and a 100-members to assimilate both in situ and satellite data form different sensors. |
|
CAWCR Reanalysis Data Weather and Climate Research) |
The ocean wave reanalysis data, using the Wave Watch III wave model interspersed with NCEP CFSR hourly winds and daily sea ice. |

[The Environment Load Factors and Region (Kara sea) for Study]
4. Results
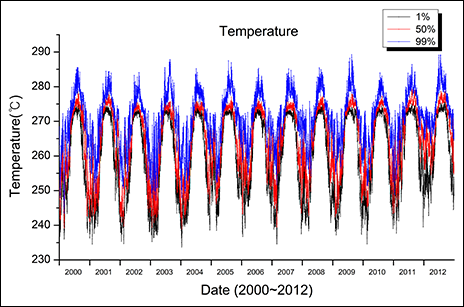
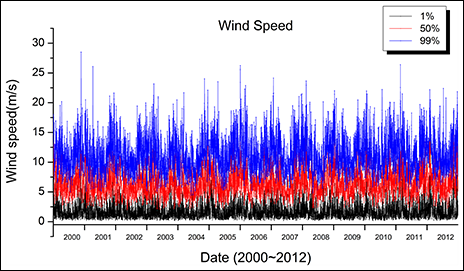
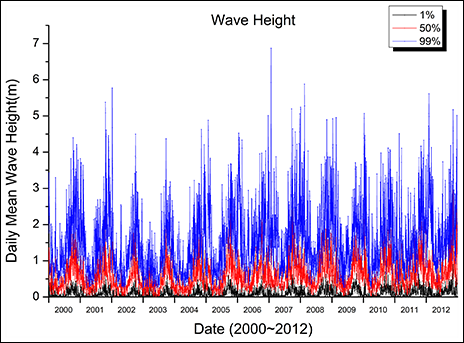
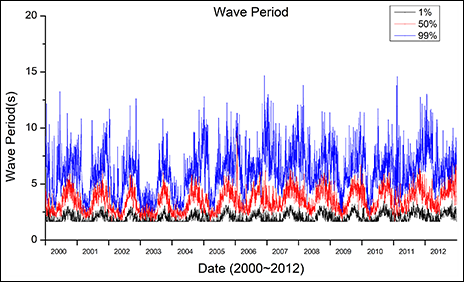
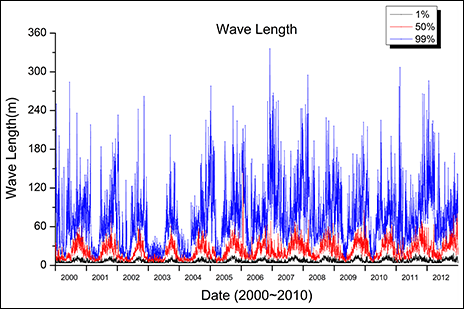
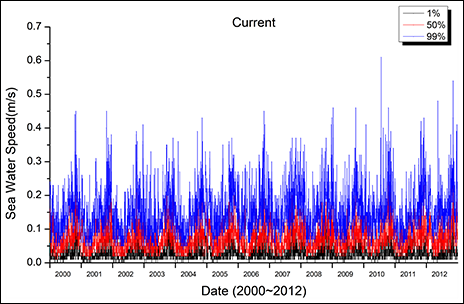
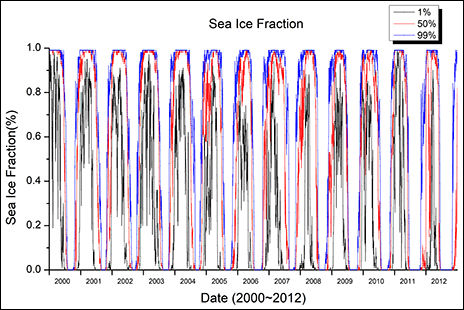
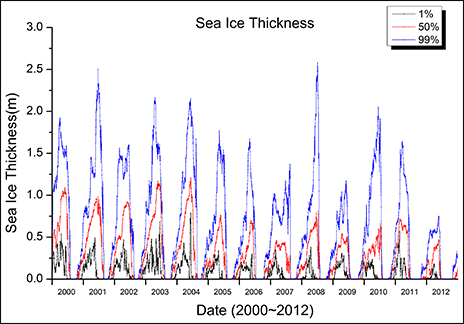
The trends of each of the factors were analyzed for daily/seasonal/annual changes for a period of thirteen years from 2000 to 2012. The minimum (1%), medium (50%) and maximum (99%) values of the factors were also obtained daily to determine the range of variability in the target region (Kara Sea).
(1) Temperature (2m above the sea level)
|
|
Lowest Minimum |
Highest Maximum |
|
Temp. |
233.68K(-39.47℃) |
289.22k |
|
Date |
11th Jan. 2004 |
6th Aug. 2009 |
|
Diff. |
55.54 ℃ |
|
(2) Wind (10m above the sea level)
|
|
Lowest Minimum |
Highest Maximum |
|
Speed |
0.14 m/s
|
28.5 m/s
|
|
Date |
17th Feb. 2006 |
22th Neb. 2000 |
|
Diff. |
28.36 m/s |
|
(3) Wave Height
|
|
Lowest Minimum |
Highest Maximum |
| Height |
-
|
6.87 m
|
|
Date |
- |
26th Jan. 2007 |
|
Diff. |
6.87 m |
|
(4) Wave Period
|
|
Lowest Minimum |
Highest Maximum |
|
Period |
1.65 s |
14.66 s
|
|
Date |
- |
23th Nob. 2006 |
|
Diff. |
13.01 s |
|
(5) Wave Length
|
|
Lowest Minimum |
Highest Maximum |
|
Length |
4 m |
336 m
|
|
Date |
- |
3th Nob. 2006
|
|
Diff. |
332 m |
|
(6) Current (Speed)
|
|
Lowest Minimum |
Highest Maximum |
|
Speed |
0.0 m/s |
0.61 m/s
|
|
Date |
- |
24th Jul. 2010
|
|
Diff. |
0.61 m/s |
|
(7) Sea Ice Fraction (Percentage of presence of sea ice in single grid)
|
|
Lowest Minimum |
Highest Maximum |
|
Frac- tion |
0.0 % |
100 %
|
|
Date |
- |
- |
|
Diff. |
100 % |
|
(8) Sea Ice Thickness
|
|
Lowest Minimum |
Highest Maximum |
|
Thick- ness |
0.0 m |
2.58 m
|
|
Date |
- |
4th Jul. 2008
|
|
Diff. |
2.58 m |
|
The various factors that affect the installation and operation of offshore plant structures can be identified, and incorporating analytical data from the last 50 years will provide a useful basis for optimized design. In addition, this observational-based numerical data can be applied not only to offshore plant structures but also to the design and operation of various structures on land and ocean.
Reference
- ERA REPORT SERIES No.1 Version 2.0, B. Paul et al., 2011
- Data Services Research Data Archive (RDA) CISL/NCAR, Steven Worley & Doug Schuster,
9 April 2014
- The Great Soviet Encyclopedia, 3rd Edition (1970-1979). © 2010 The Gale Group, Inc.


